ForeUI can convert your prototype to HTML+JavaScript simulation, which can be directly reviewed in web browsers. Since ForeUI is not as smart as people, it could not recognize the incorrect syntax input in any field that supports expression, at least for now. If your prototype contains incorrect expression, it will be converted to incorrect JavaScript code, which may halt your simulation in browser.
If you find your simulation does not work as your expected, especially some elements do not respond your input, you will need to troubleshoot your simulation and fix the expression in your plot. The primary problem is to find out which element has incorrectly defined actions. The troubleshooting is not difficult at all, you don’t have to be a programmer to understand the process.
Preparation
Although we don’t need to go deep into JavaScript code to find out what happened, we still need a JavaScript debugger to locate the problem. Most web browsers have their built-in debuggers or plug-ins for debugging purpose. You can choose one of the following combinations for debugging:
- Firefox + Firebug (plug-in, can be downloaded here)
- Chrome + JavaScript Console (built-in, press Ctrl+Shift+J to activate)
- Safari + Error Console (built-in, here is how to activate it)
- Opara + Error Console (built-in, press Ctrl+Shift+O to activate)
- IE + Script Editor (component from Office, here is the How-To)
The Firefox + Firebug combination is my favorite, and I will use it as example. If you use other debuggers, the GUI of debugger may vary but the main idea is still the same.
Example Plot Creation
I create a simple plot to demonstrate the troubleshooting. The plot has only one page and there are three buttons inside. As shown below:

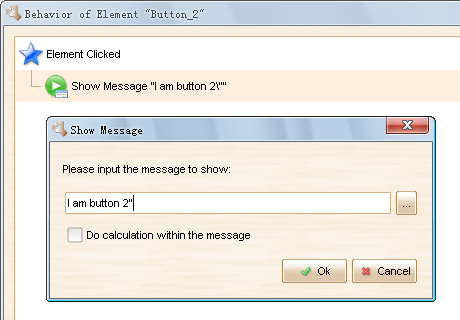
Every button has almost the same behavior: when it is clicked, it shows a message “I am button N” (N=1,2,3). I intended to insert an error in the second button:
 As you can see, I inserted an additional double quotation marks at the end of the message to show. Since the double quotation marks is not escaped and it can not find the pairing in the message, it will be kept in the message and break the syntax of the script and halt the simulation.
Troubleshooting
When we run the simulation in Firefox (with Firebug installed and activated), Firebug immediately detect the syntax error and show it in Firebug console.

Clicking into the green link and the source code that has syntax error will be highlighted in a pop up window:

Here we don’t need to understand what’s wrong with the code, just find out where the problem is. As highlighted above, the error is in a function started with “Button_2”, which means the error happens in Button_2.
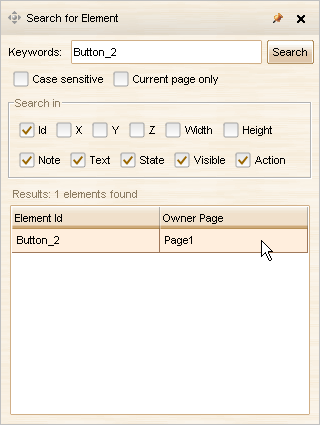
For such a simple plot, we can definitely find out where the Button_2 is. If the plot is big and complex, we will need to search Button_2 in the plot. Just press Ctrl+F to open the search window and input the keyword “Button_2” to search:

Clicking on the search result will bring us to the page and select the target element. We can press Ctrl+D to review its action definition.
With the help from JavaScript debugger, we can quickly narrow the problem and locate the problematic element, and then have it fixed.