ForeUI V3.80 is released today. This version introduces a new approach to optimize your HTML5 simulation, which is extremely useful for people who want to create big, complex prototype with ForeUI.
After actively working on a plot for some time, you may find out that your plot becomes bigger and bigger. Loading and saving the plot file is slow, and it may take several minutes to launch the simulation in web browser. When this happens, we would suggest you to optimize your plot before adding more content into it. Actually, the best practice is to understand how to avoid unnecessarily increase your plot size, and keep your plot small and neat at the beginning. We have a document to introduce all currently known tricks for this topic.
Before version 3.8, those tricks focus on avoiding duplicated or useless content in your plot. Since this new version, we have a new approach, which is to reduce the number of DOM objects that need to be loaded by the web browser, hence directly make your HTML5 simulation smaller and faster. Consider such an example: on the page you have a chart created with basic shape elements, such as rectangle, arrow line, text box etc., and you have two buttons to navigate between pages. Actually only these two buttons have their behavior defined, and other elements are just shapes or text, which are completely static. If you use older version of ForeUI to generate HTML5 simulation for it, all those elements will be converted to DOM objects, which have to be loaded by the web browser. If your plot has a lot of shape elements which are actually static during the simulation, loading them as DOM objects is a waste of resource for web browser, and you will see the simulation loading time meaninglessly prolonged.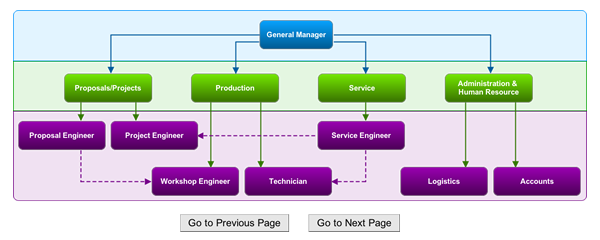 I guess you already know what I am going to say, the best way to treat those “static” element is to put them into an image and let them display as a static background, while those buttons that have behavior defined should be kept as they are. So to simulate the page mentioned above, the web browser just need to load 3 DOM objects: the static chart image and two buttons, which will be very fast! Now the question is: how to tell ForeUI to do so?
ClipArt Element
The answer is to use ClipArt element, which is newly included in ForeUI V3.80. This new ClipArt element is not an element that you can directly drag and add into your plot. You will need to select one or more elements and then click the ![]() button in the tools panel to wrap it/them as a ClipArt. ClipArt is just like a Group, but it will be output as a static picture in the HTML5 simulation, which means all its members will not be interactive during the simulation. So please make sure not to abuse it, and do not put any element that has (or will have) behavior defined into the ClipArt, otherwise ForeUI will warn you in the behavior editor:
button in the tools panel to wrap it/them as a ClipArt. ClipArt is just like a Group, but it will be output as a static picture in the HTML5 simulation, which means all its members will not be interactive during the simulation. So please make sure not to abuse it, and do not put any element that has (or will have) behavior defined into the ClipArt, otherwise ForeUI will warn you in the behavior editor:
Wrapping some elements into a ClipArt looks like to put a static picture into your page, but there is difference: you can not modify the content of static picture in ForeUI, but you can edit the members of ClipArt as you wish. What’s more, you can always restore those elements from the ClipArt. This is extremely useful when you need to modify the diagram frequently.
You maybe interested in how good this kind of optimization can be, let’s see some comparisons.
The two plots in the comparison have the same content and behavior, the only difference is the second one converts all static elements into ClipArt elements. The plot files and HTML5 simulations are available in the table, so you can do the test by yourself. Your result may vary a little bit, depends on the hardware and software environment, but you will see the similar result, that the plot use ClipArt can be loaded much faster.
If you have a big plot, try using the methods mentioned in this document to optimize its size. If you are just starting a new plot, please also learn those tricks and keep your plot small. If you just want to create a prototype with less than 20 pages, it should be fine to ignore all these optimizations. However, if you are targeting a prototype with 100+ pages and still want it to be small and fast (it is possible, we have saw people did it), those optimizations are almost mandatory.


